


The Statistics section of the Admin Control Panel provides a central location for monitoring the health, growth, and activity of your community. Whether you're tracking member engagement, content creation, traffic trends, or system performance, these reports help you understand how your community is performing over time.
The available statistics are presented as clear charts and summaries, making it easy to identify trends, measure the impact of changes, and make informed decisions about the ongoing management of your community. In the following guides, we'll explore each of the available statistics and explain how they can help you gain valuable insights into your site's activity.
Overview
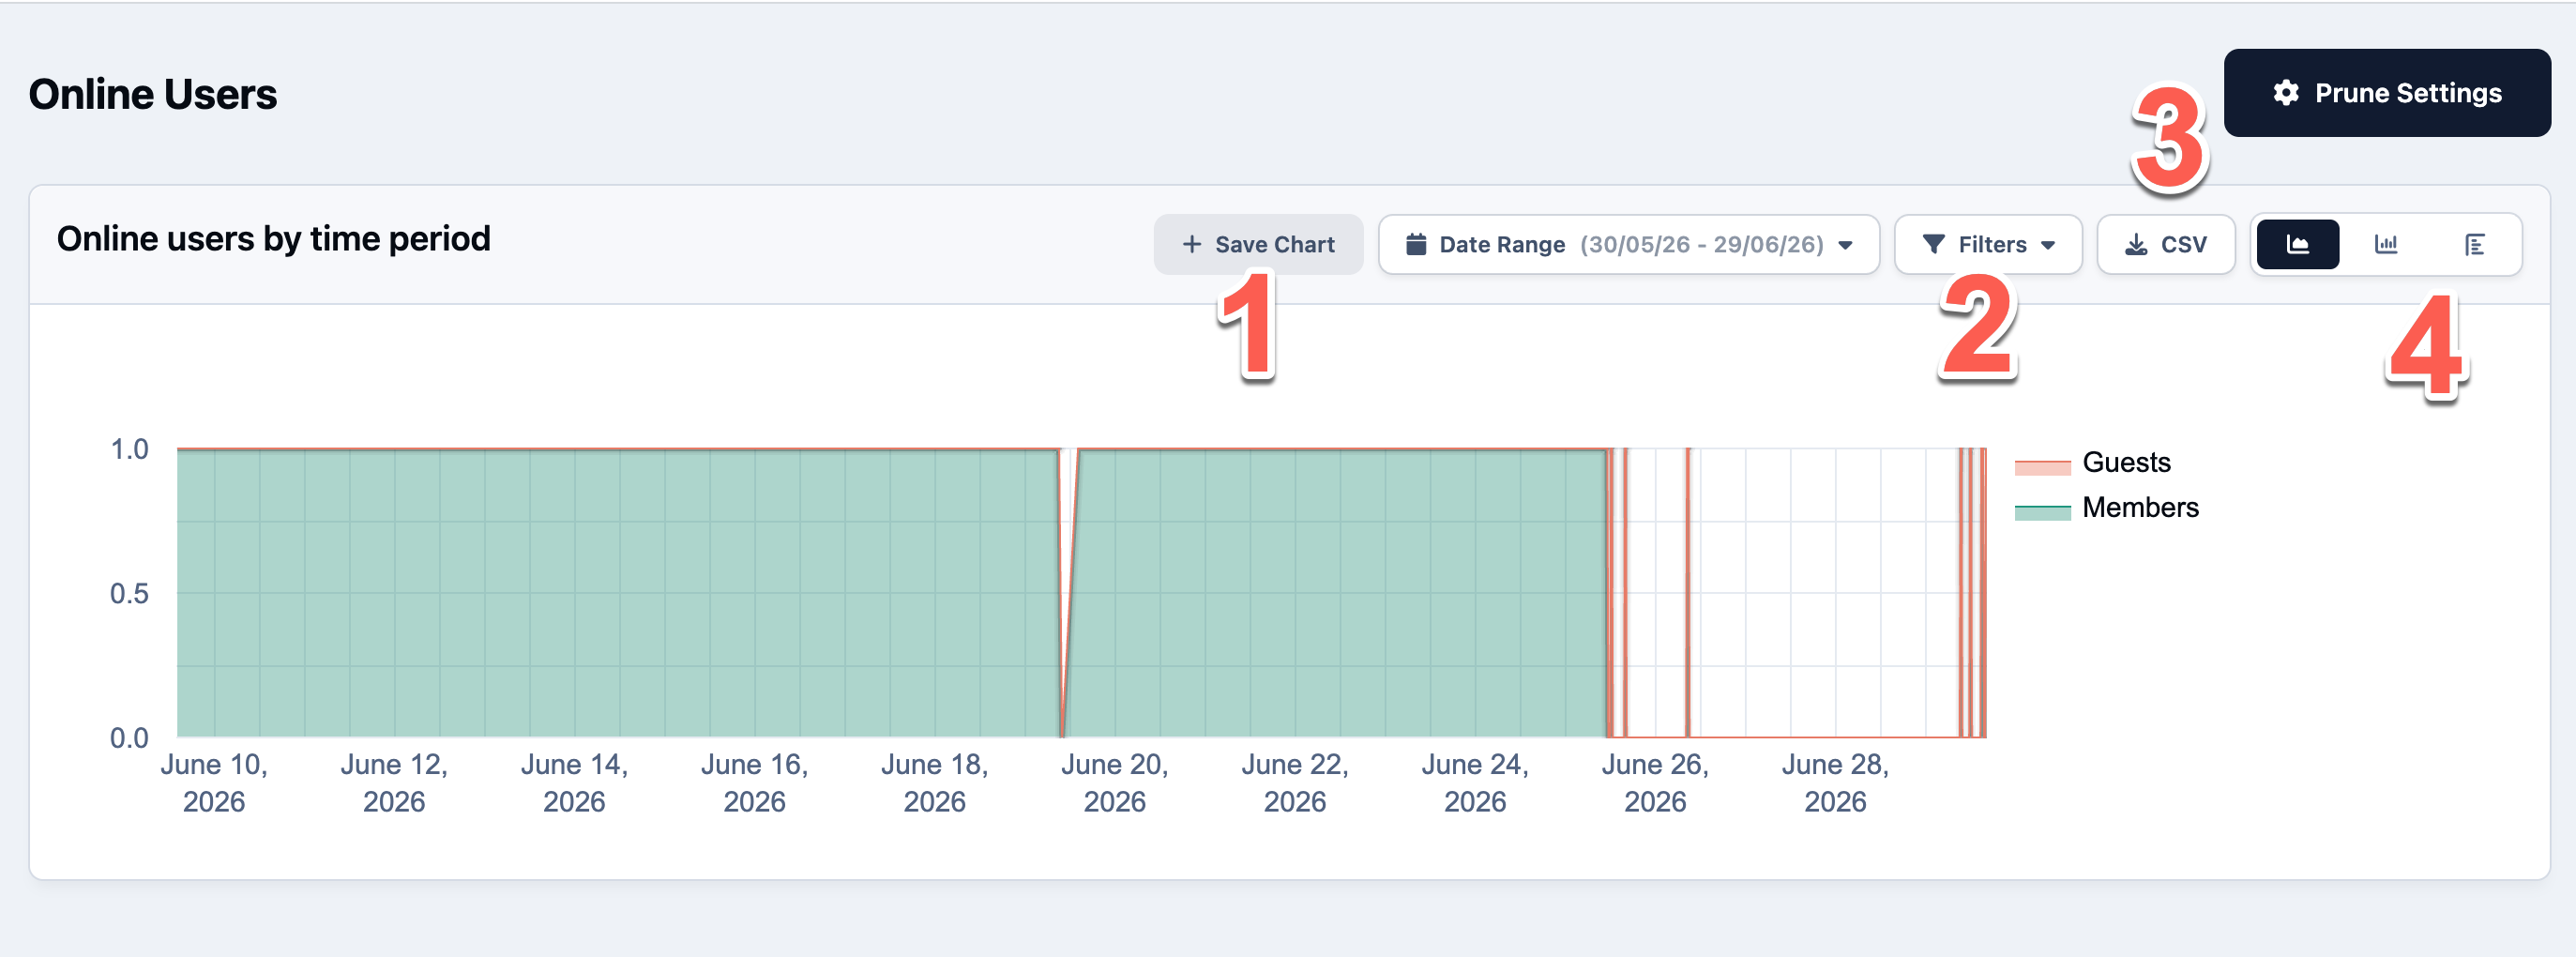
Below is an overview of a typical report. While you may encounter different report views throughout the suite, most share the same core features.
The numbered items in the image below are explained below.
1 - Save Chart - This allows you to save charts to a report (discussed below). Giving you an easy quick view of one or multiple statistics
2 - Filters - Reports may contain filters, where you can then narrow down what you wish to look at. In the example below, we see users online, and show the different groups. You may wish to exclude certain groups, or only show one specific view.
3 - Export - You can export reports to CSV for easy use of reporting data in an external setting.
4 - Report views - You can switch from an Area chart, to a bar or column chart
Report Sections
Reports
Reports are a saved collection of one or more statistics from the Statistics area of your AdminCP. They allow you to bring together the metrics that are most important to you into a single view, making it easy to monitor your community's performance without having to navigate between multiple statistics.
Reports can be tailored to your specific needs, whether you want to track member growth, content creation, engagement, or other key metrics. By grouping related statistics together, you can quickly review trends and gain an at-a-glance overview of how your community is performing over time.
To create or add to a report, click "Save Chart" on any report
Saving a Report
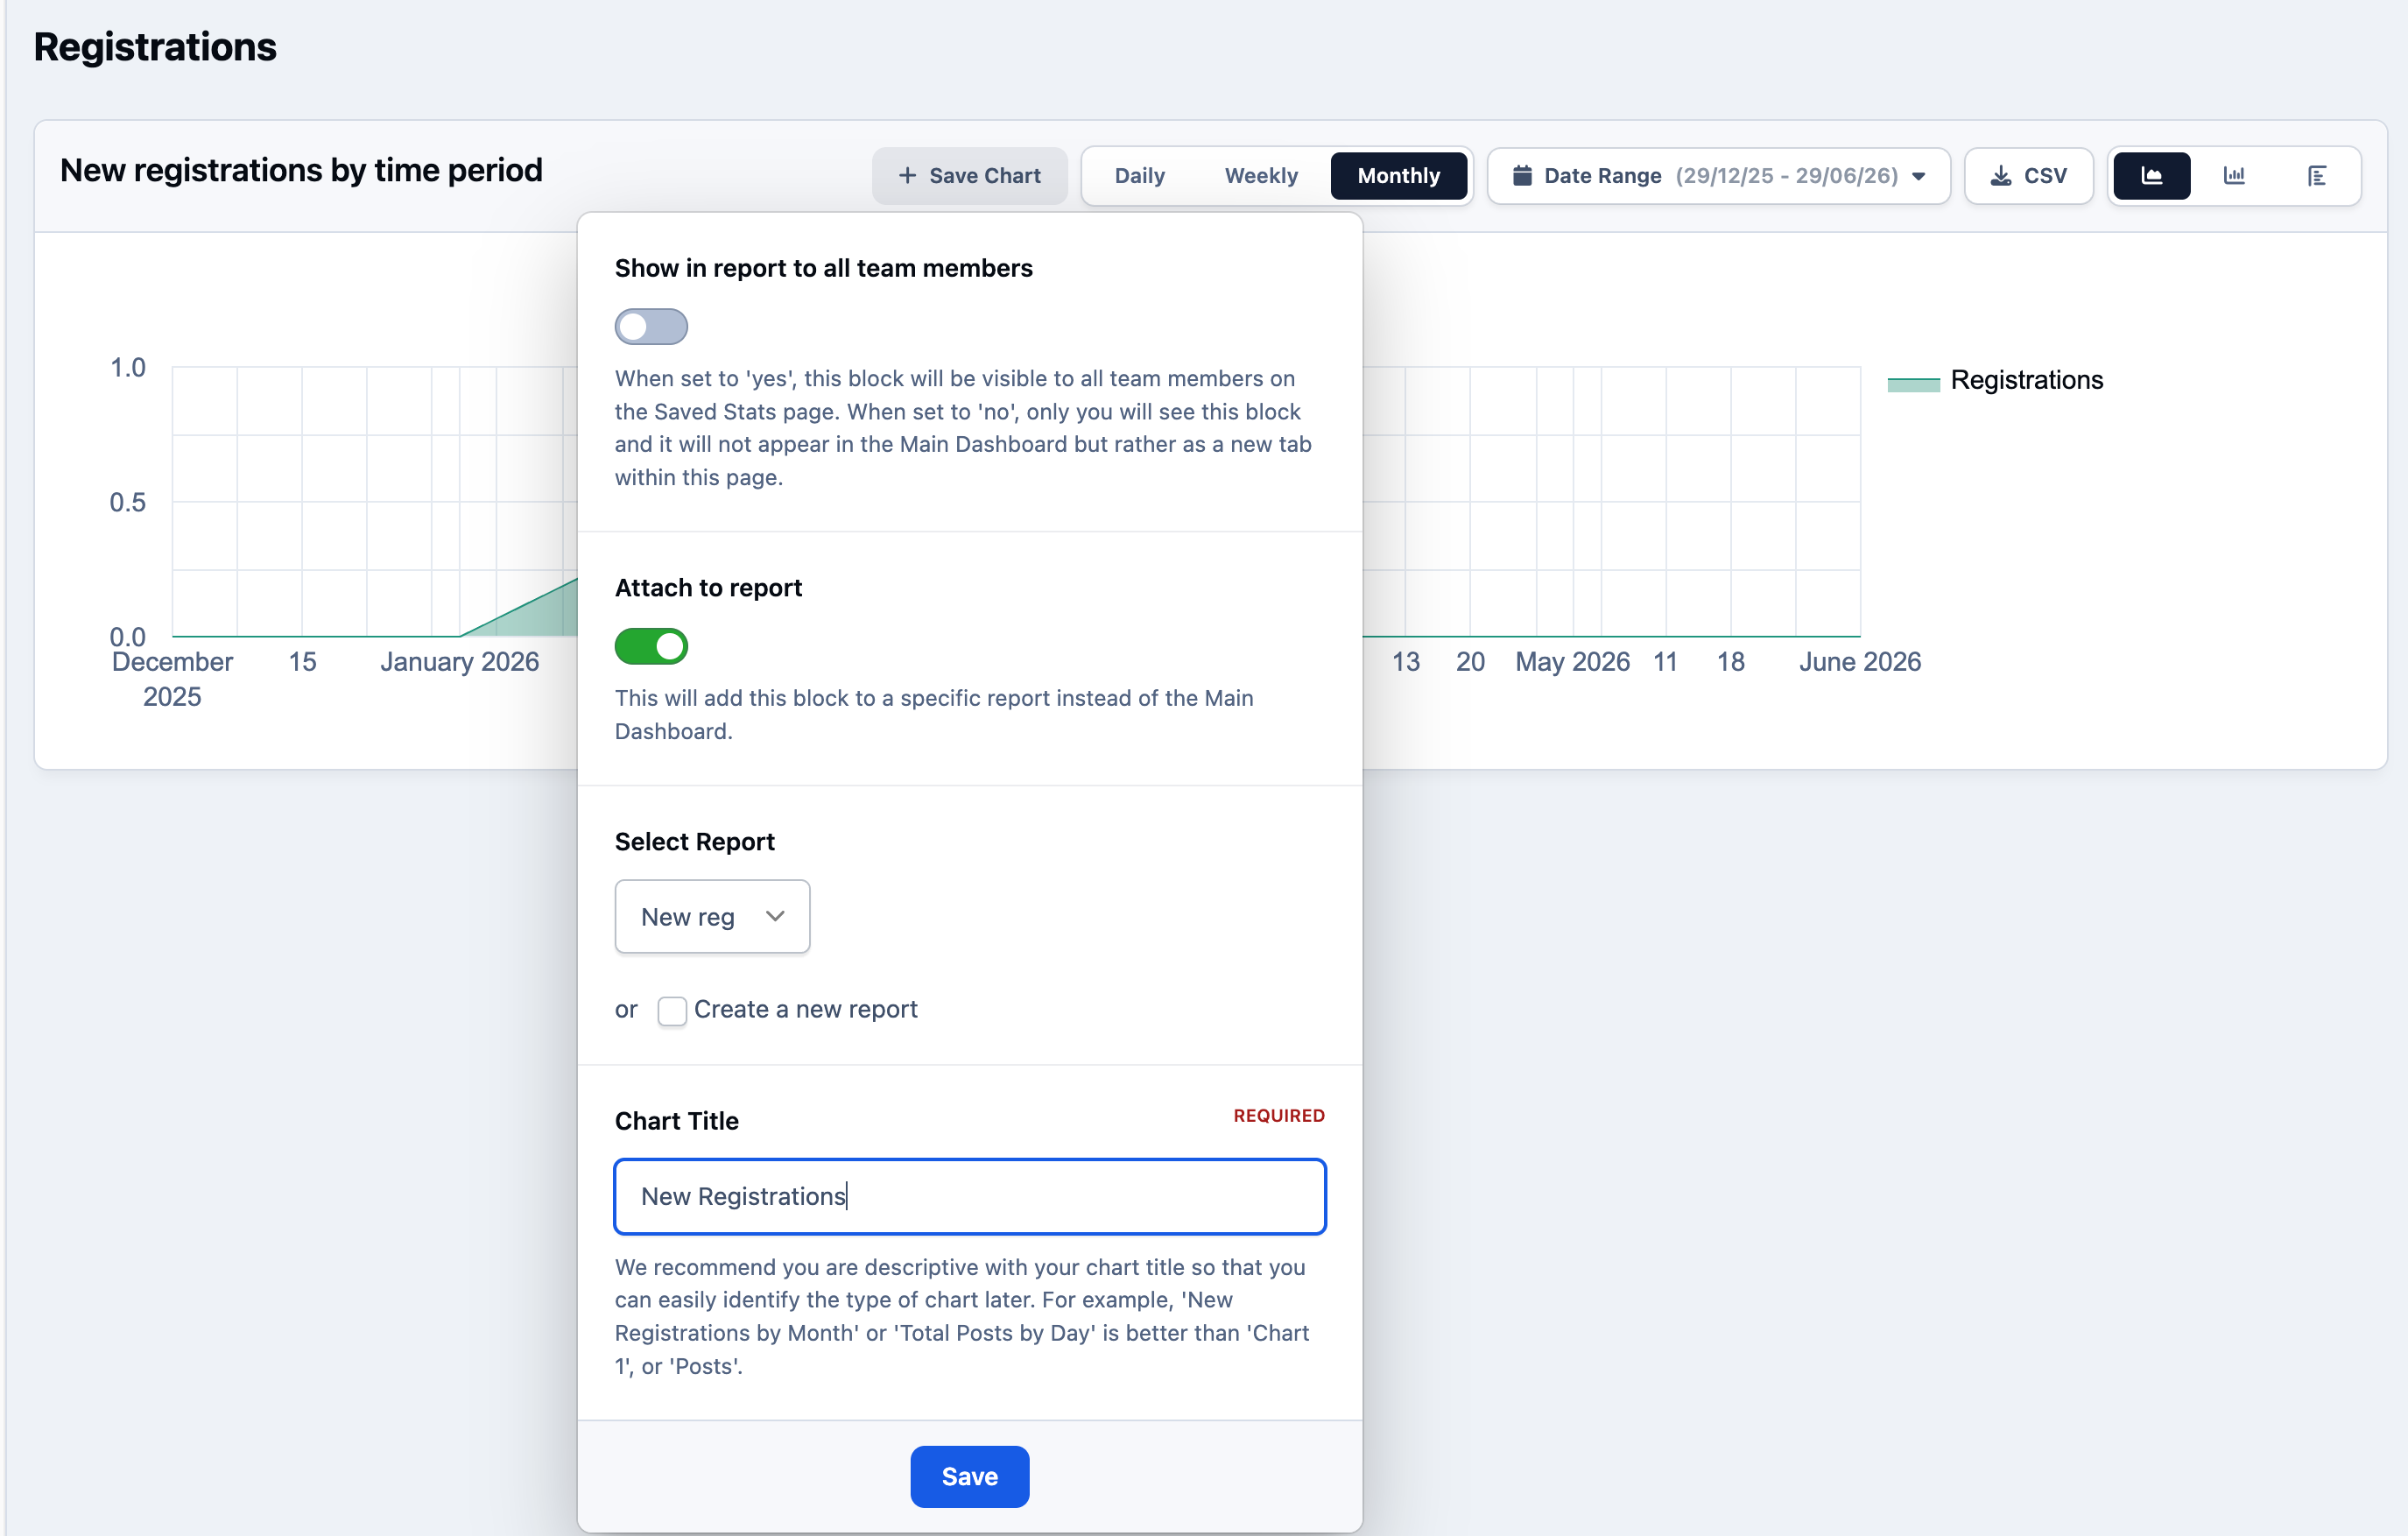
From here you can chose various options, including which report to add it to, or creating a new report. The charge title is what will show at the top of that chart in your report.
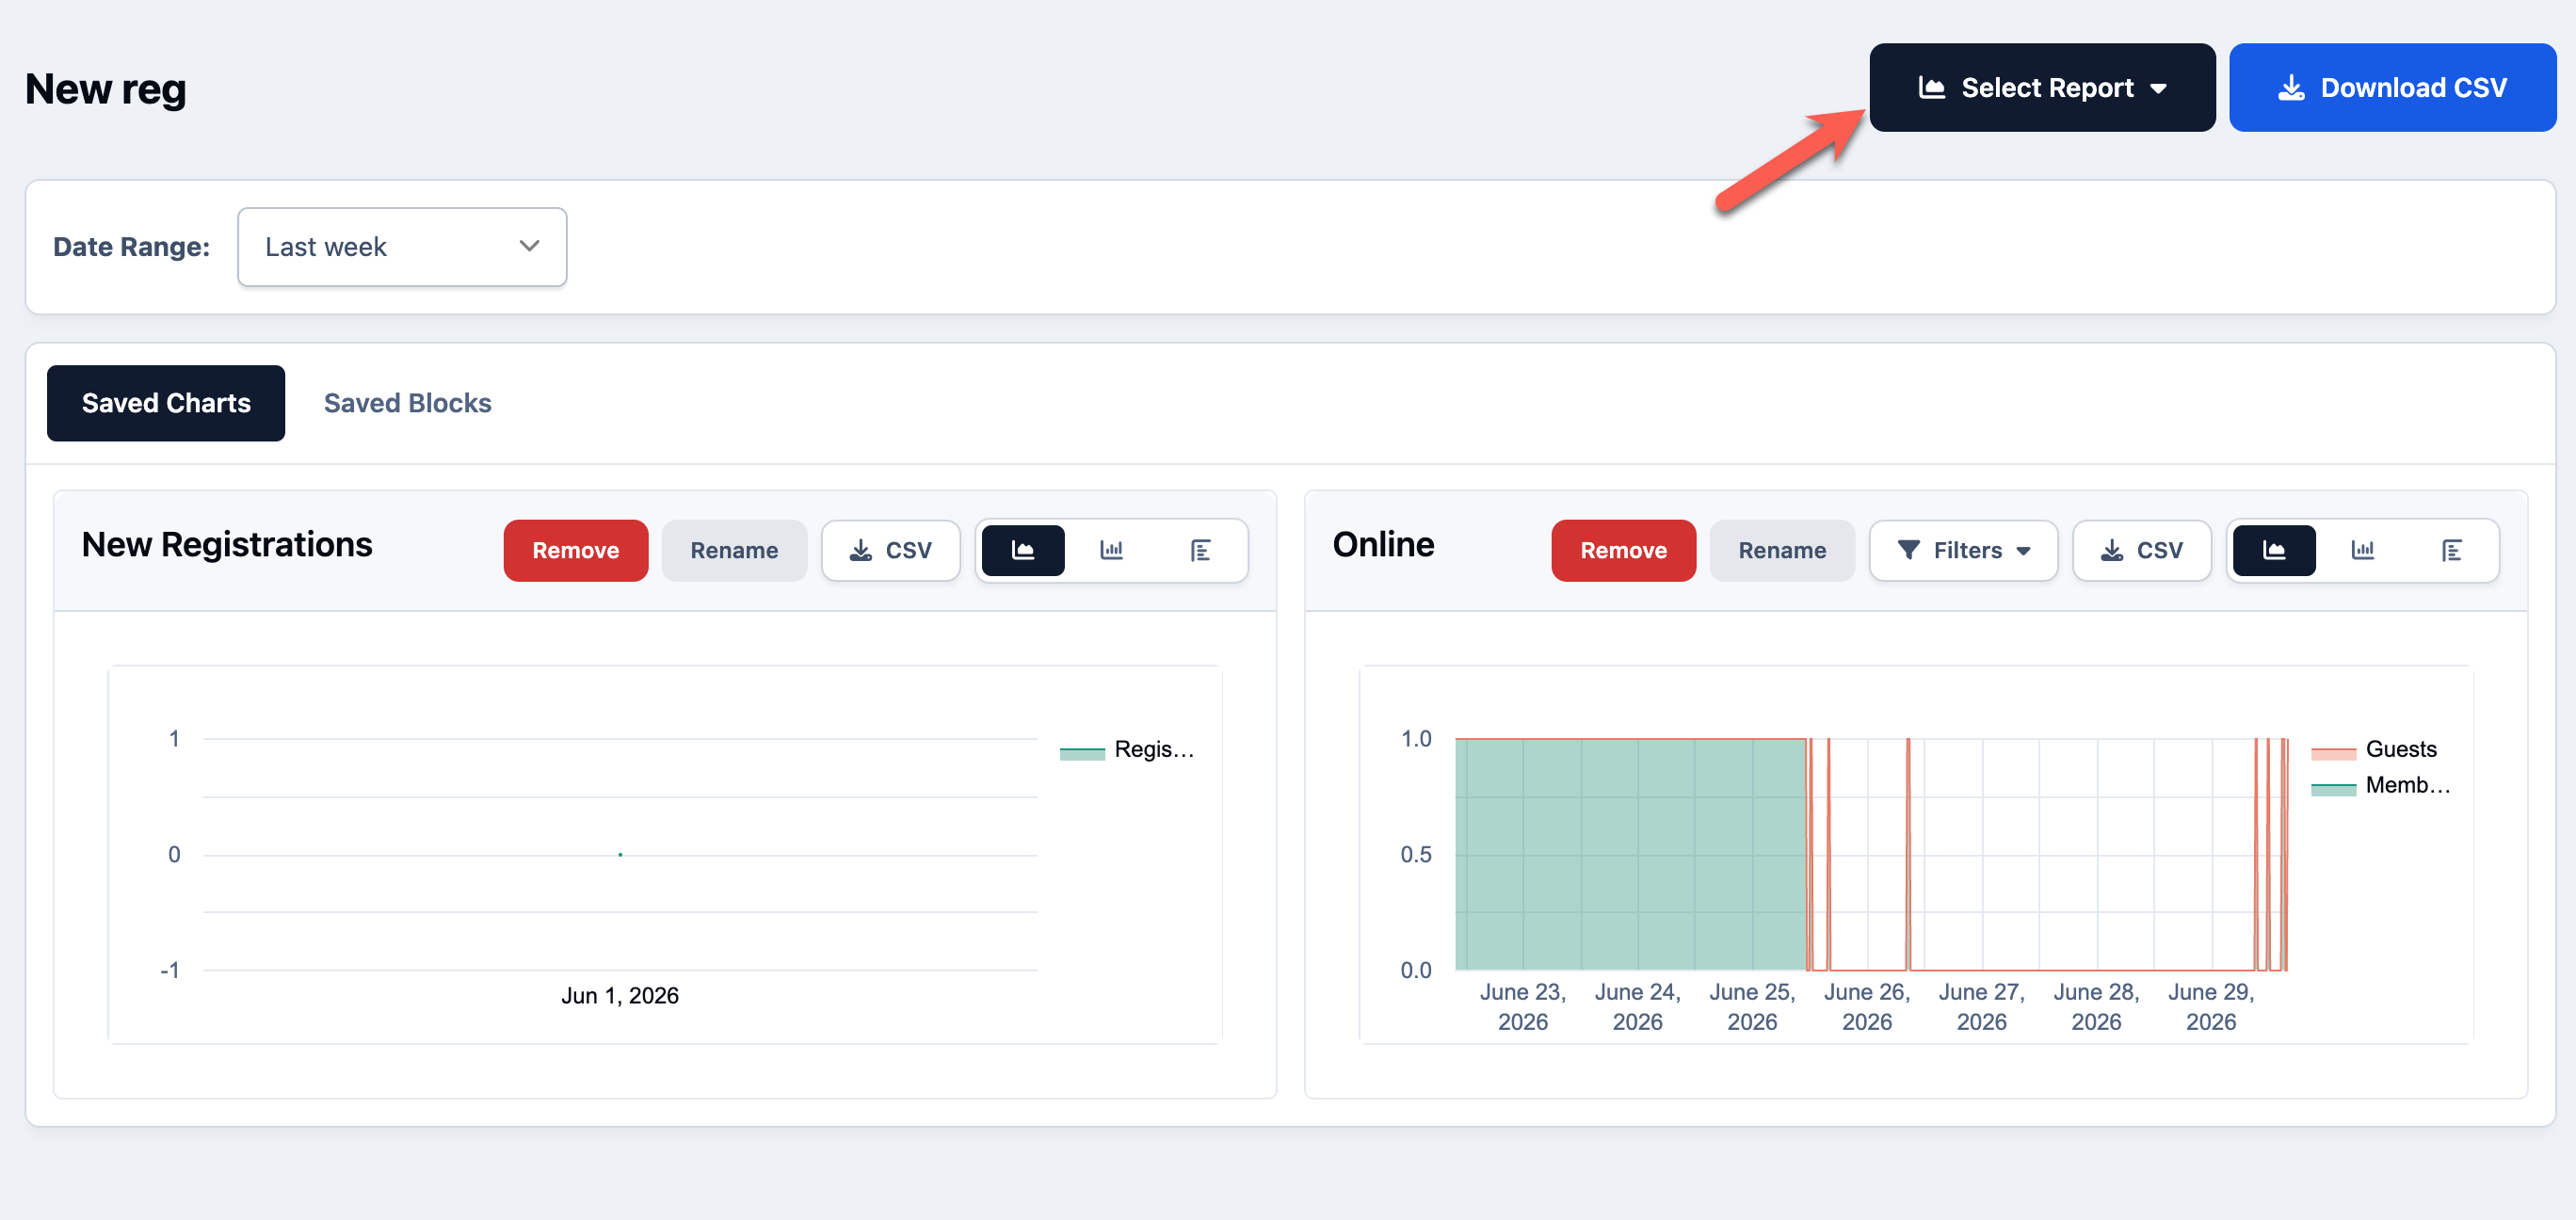
All reports will show within your Saved Reports section at the top of the Statistics section in the Admin CP. You can select a report in this area, in order to view that report
Selecting Reports
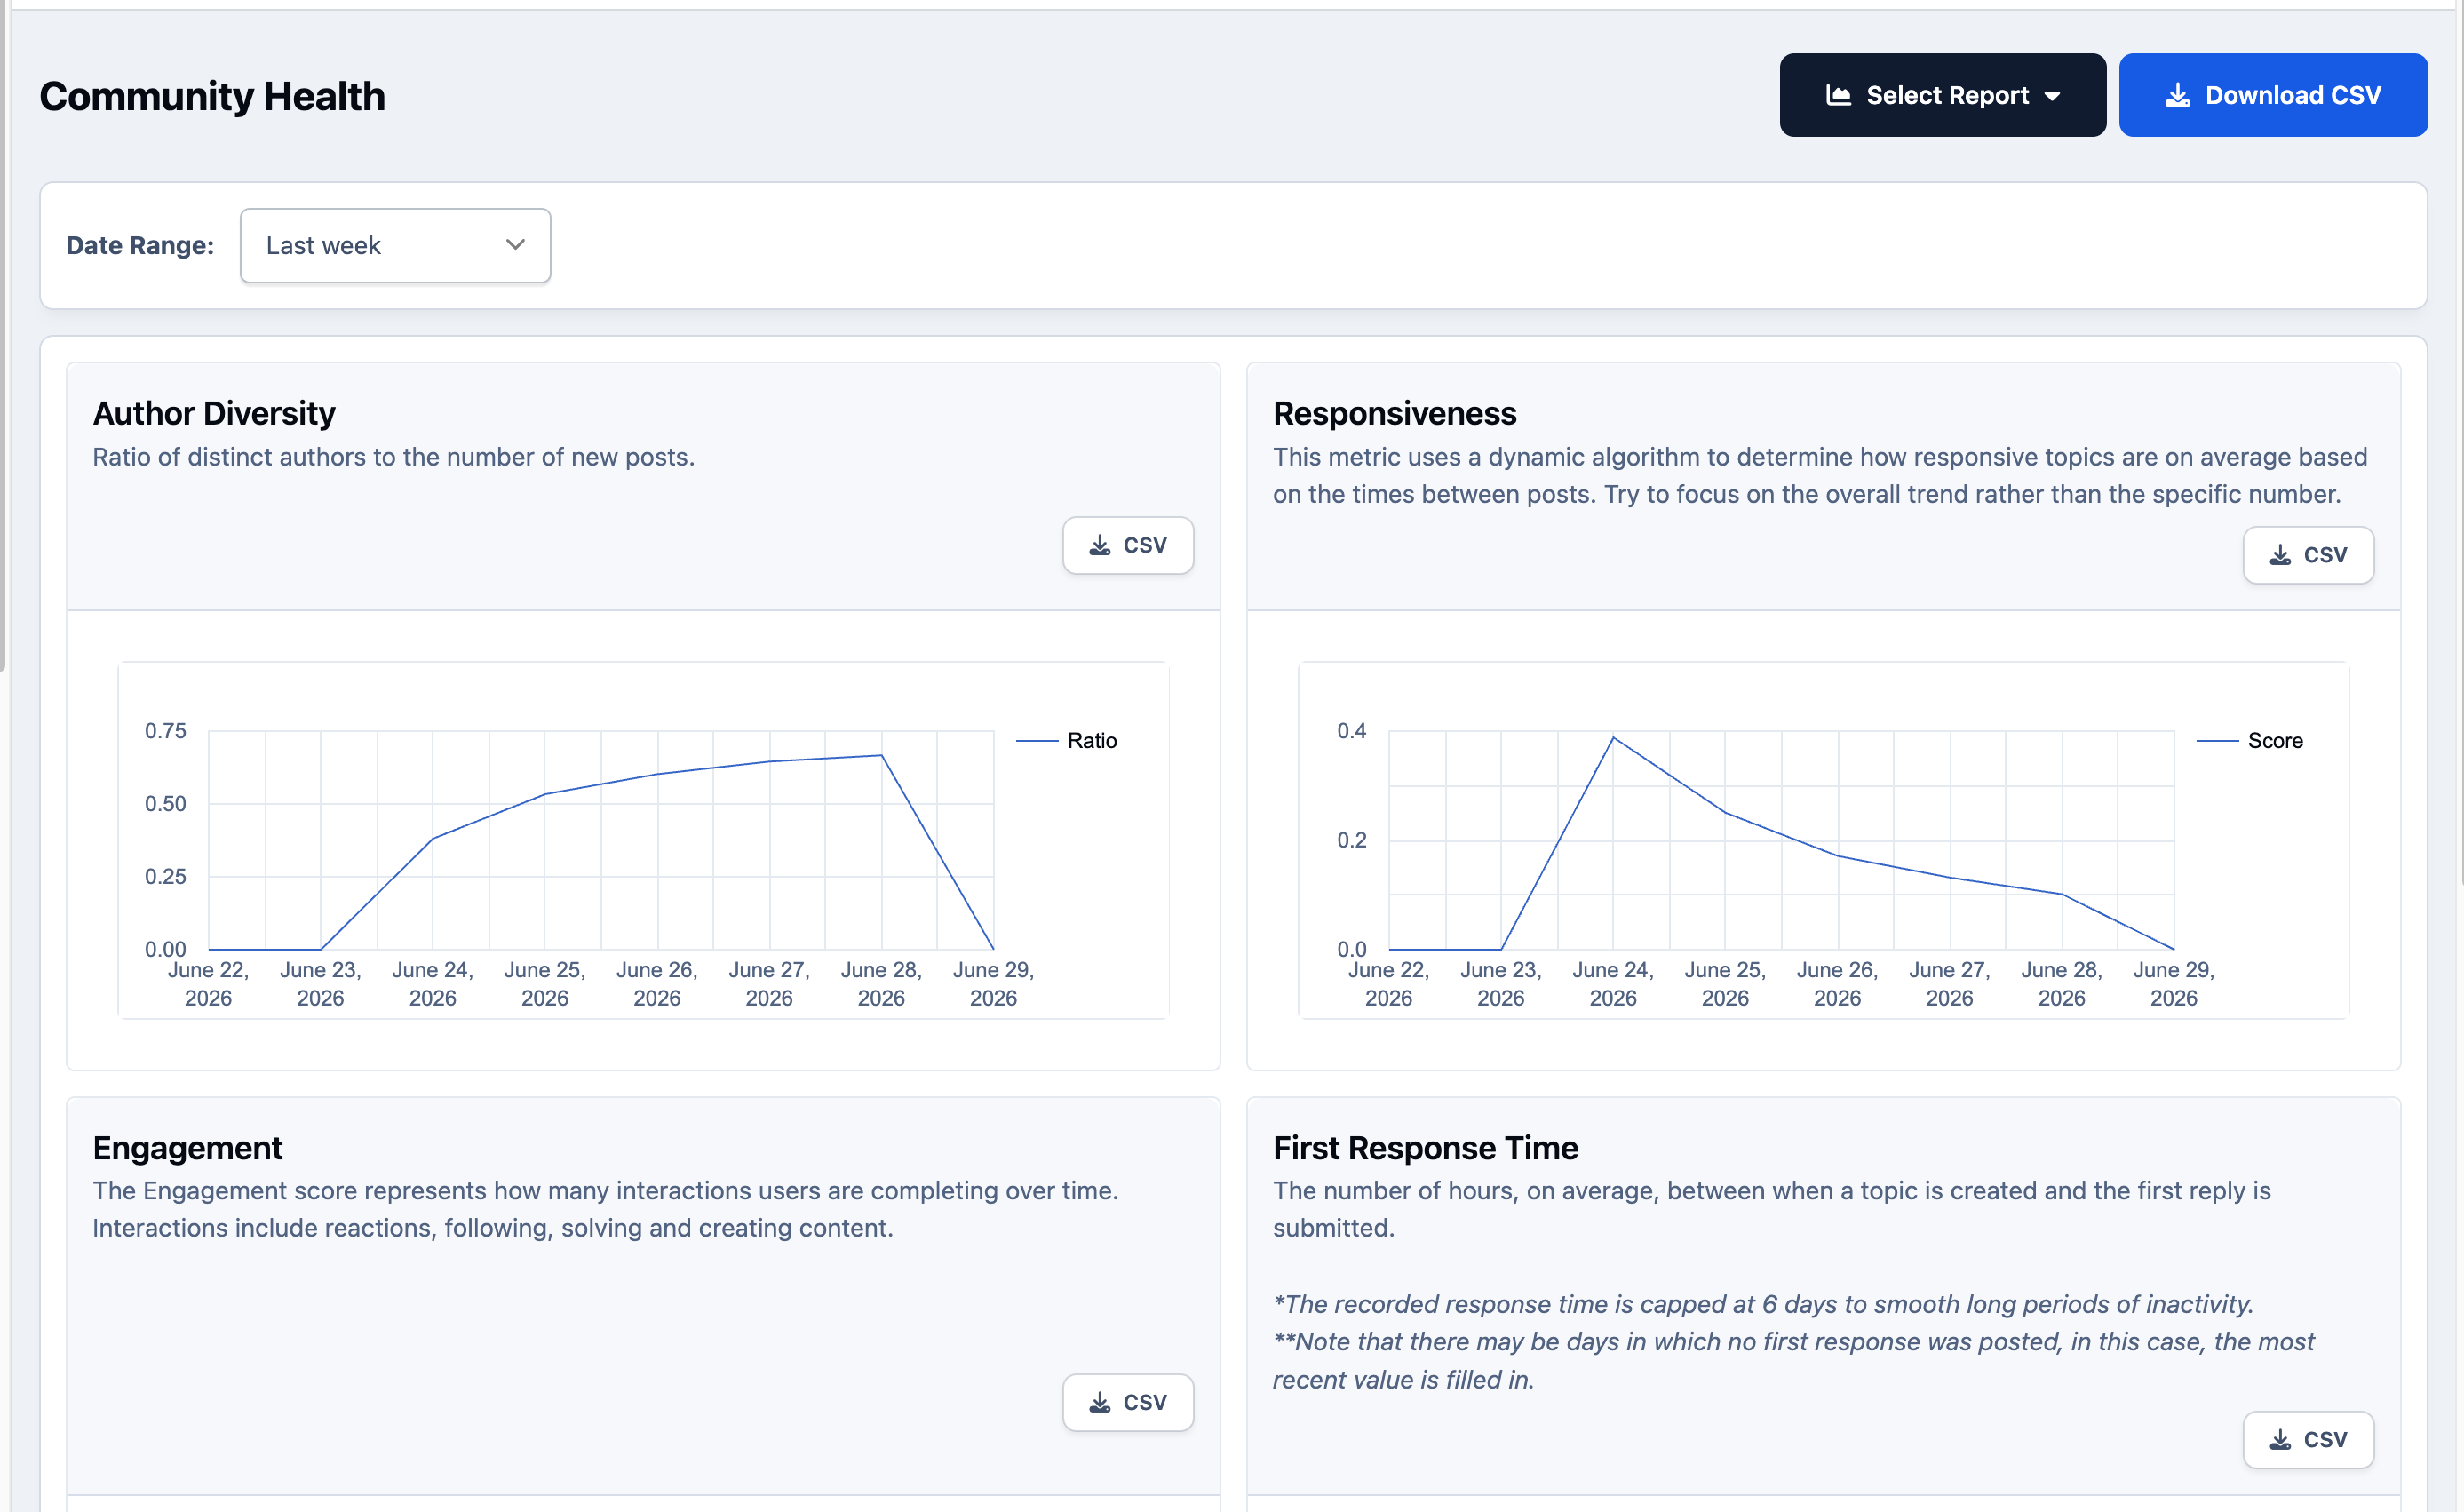
There are also some built in reports you can choose from, such as Community Health
Community Health Report
Recommended Comments